Overview
In this lab, you will delve deeper into Leafmap, a powerful Python package for interactive geospatial mapping and analysis. You will explore how to work with various types of raster and vector data, customize basemaps and map layers, and visualize data using Cloud Optimized GeoTIFFs (COGs), PMTiles, GeoParquet, and other formats. You will also learn how to enhance your maps with advanced features like legends, colorbars, marker clusters, and split maps for comparison.
Objective
Create and customize interactive maps using Leafmap.
Add and configure basemaps, XYZ tile layers, and WMS layers.
Visualize various raster formats such as GeoTIFF, Cloud Optimized GeoTIFF (COG), and multi-band imagery.
Explore vector data visualization, including marker clusters and choropleth maps.
Implement advanced mapping features like legends, colorbars, and split map comparisons.
Exercise 1: Creating an Interactive Map
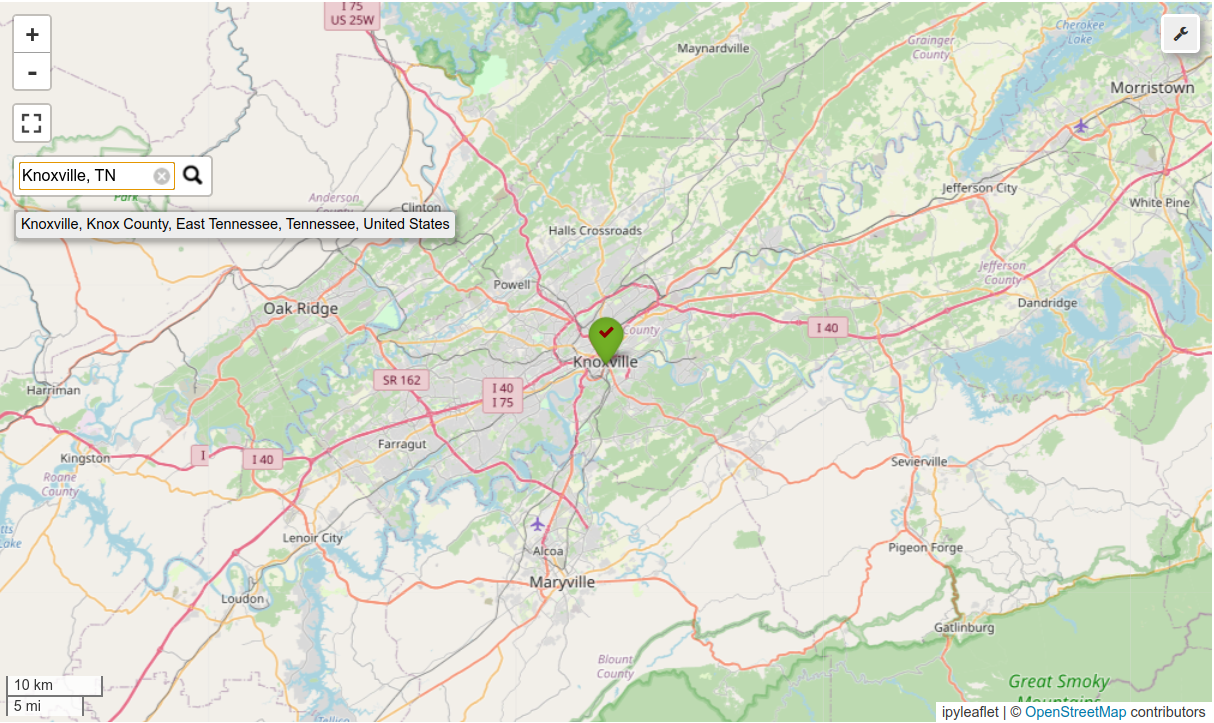
Create an interactive map with search functionality that allows users to search for places and zoom to them. Disable the draw control on the map.
Exercise 2: Adding XYZ and WMS Tile Layers
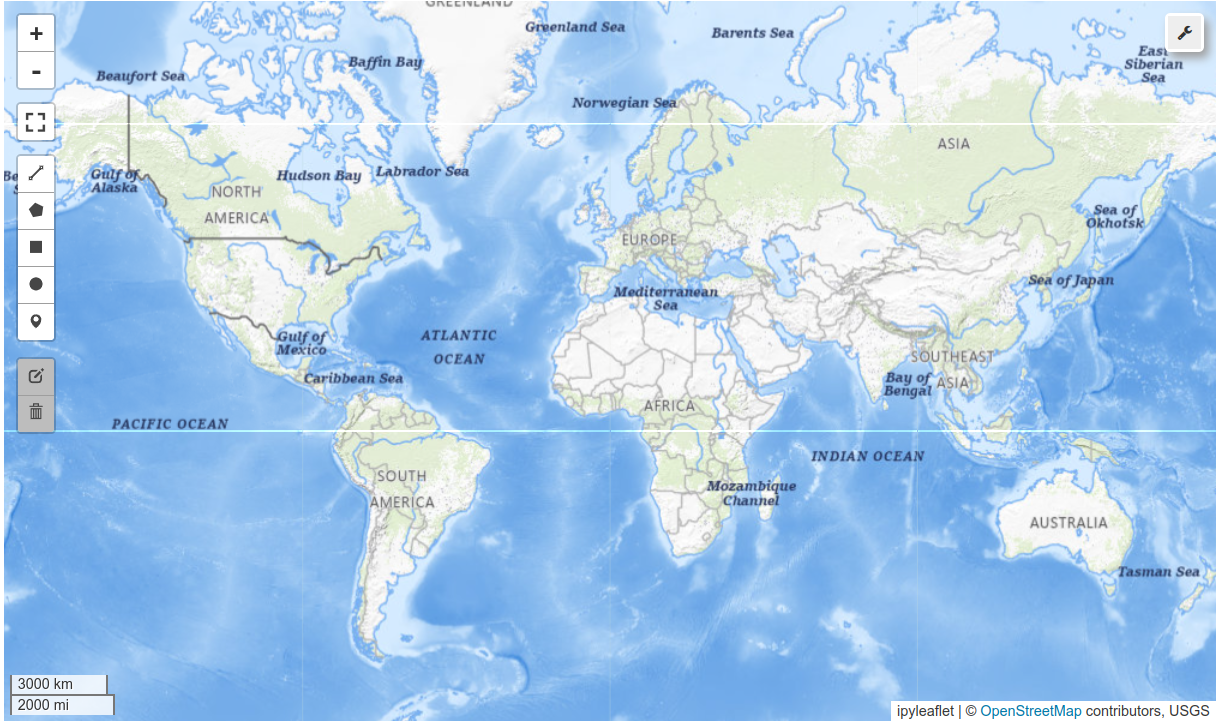
Add a custom XYZ tile layer (USGS Topographic basemap) using the following URL:
URL:
https://basemap.nationalmap.gov/arcgis/rest/services/USGSTopo/MapServer/tile/{z}/{y}/{x}
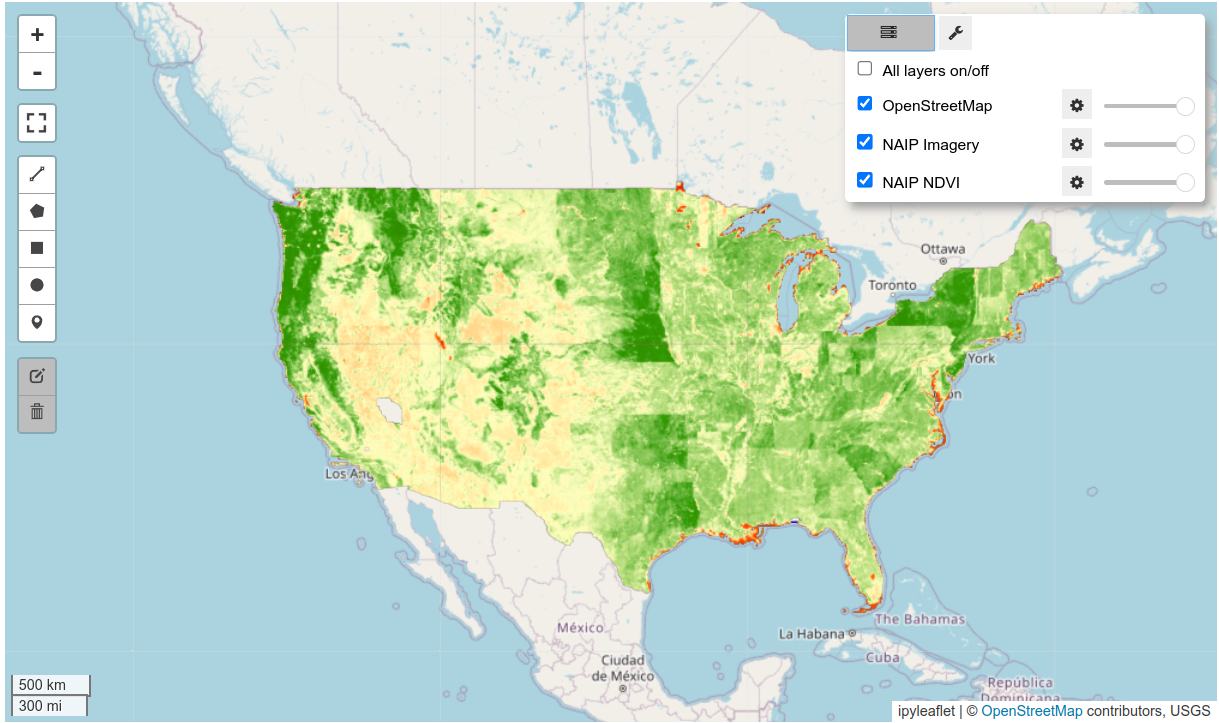
Add two WMS layers to visualize NAIP imagery and NDVI using a USGS WMS service.
URL:
https://imagery.nationalmap.gov/arcgis/services/USGSNAIPImagery/ImageServer/WMSServer?Layer names:
USGSNAIPImagery:FalseColorComposite,USGSNAIPImagery:NDVI_Color
Exercise 3: Adding Map Legends
Add the ESA World Cover WMS tile layer to the map.
URL:
https://services.terrascope.be/wms/v2?Layer name:
WORLDCOVER_2021_MAP
Add a legend to the map using the leafmap built-in
ESA_WorldCoverlegend.
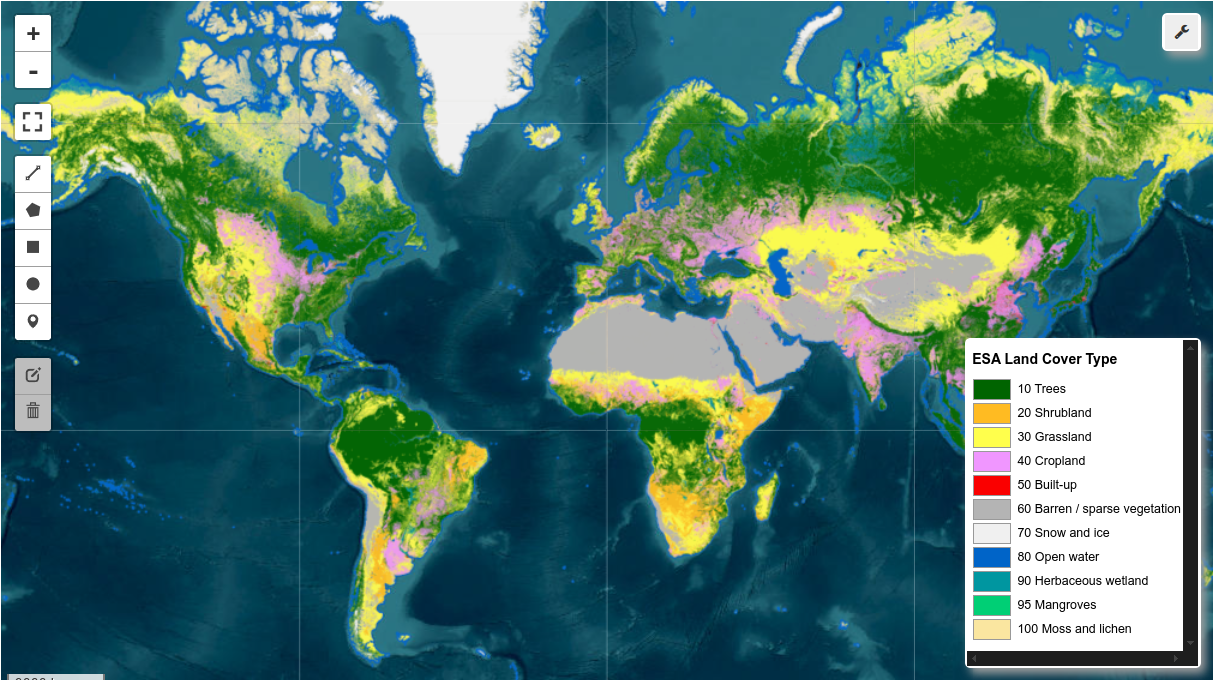
Exercise 4: Creating Marker Clusters
Create a marker cluster visualization from a GeoJSON file of building centroids:
URL: https://
github .com /opengeos /datasets /releases /download /places /wa _building _centroids .geojson Hint: Read the GeoJSON file using GeoPandas and add “latitude” and “longitude” columns to the GeoDataFrame.
Create circle markers for each building centroid using the
Map.add_circle_markers_from_xy()method with the following styling:Radius: 5
Outline color: “red”
Fill color: “yellow”
Fill opacity: 0.8
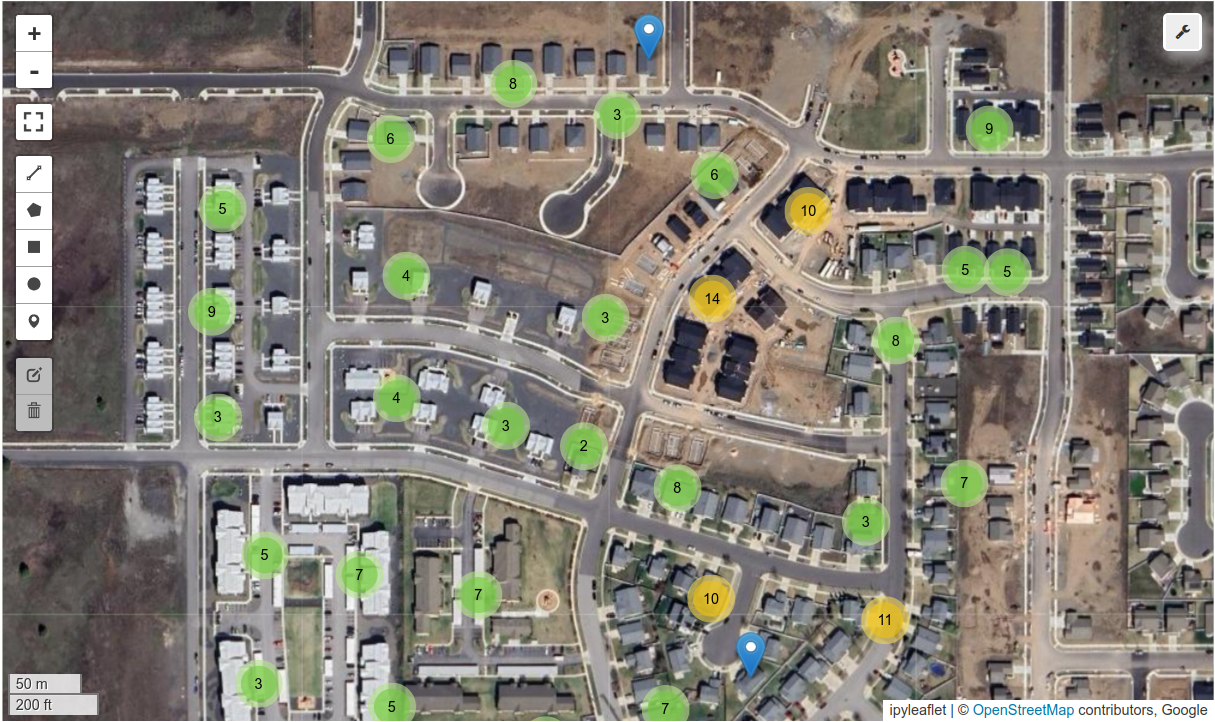
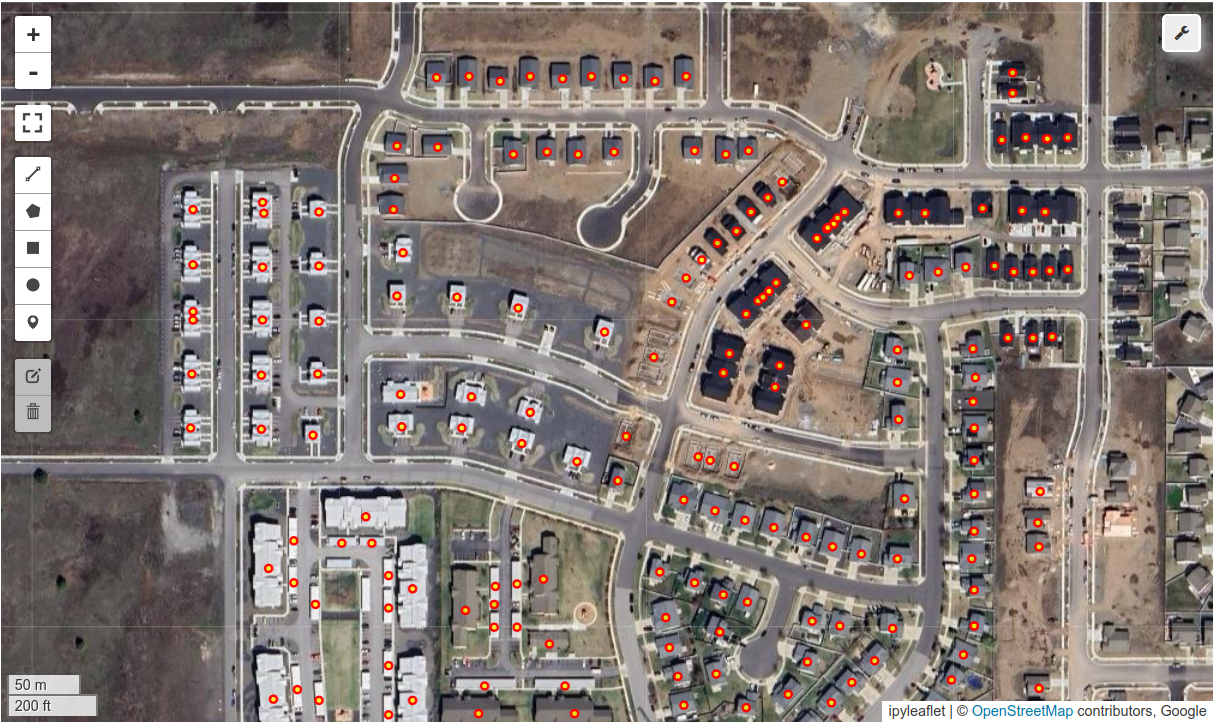
Exercise 5: Visualizing Vector Data
Visualize the building polygons GeoJSON file and style it with:
Outline color: “red”
No fill color
URL: https://
github .com /opengeos /datasets /releases /download /places /wa _overture _buildings .geojson
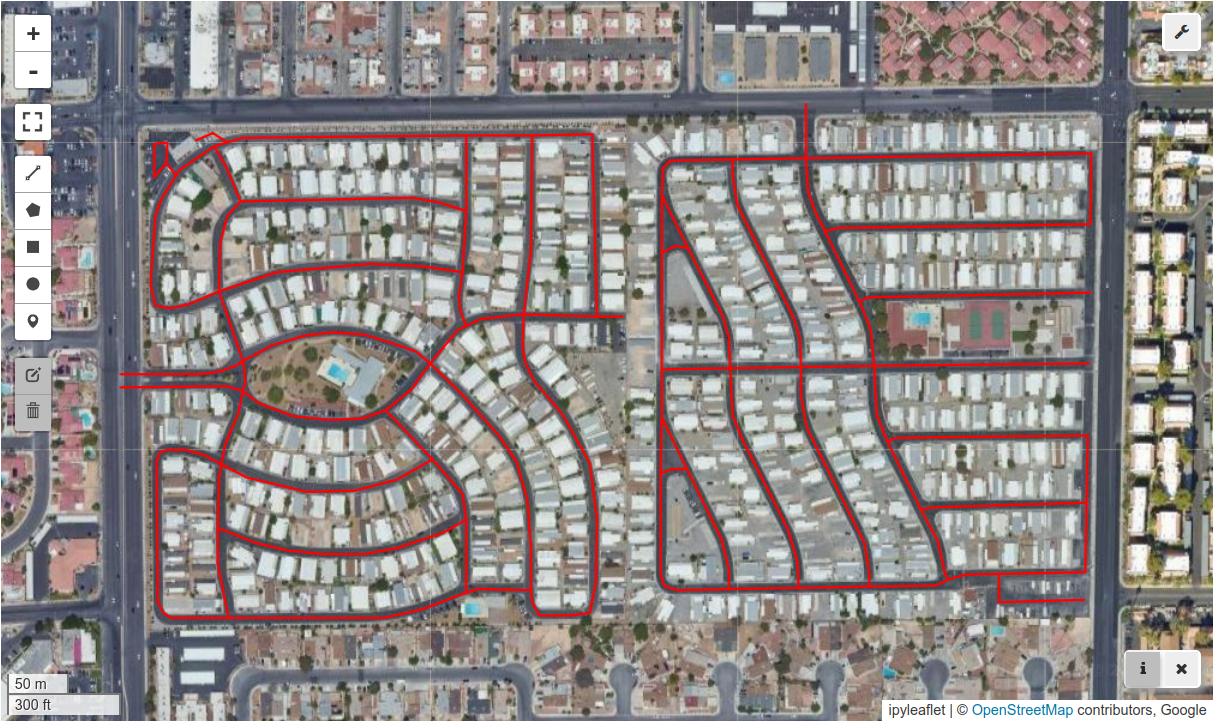
Visualize the road polylines GeoJSON file and style it with:
Line color: “red”
Line width: 2
URL: https://
github .com /opengeos /datasets /releases /download /places /las _vegas _roads .geojson
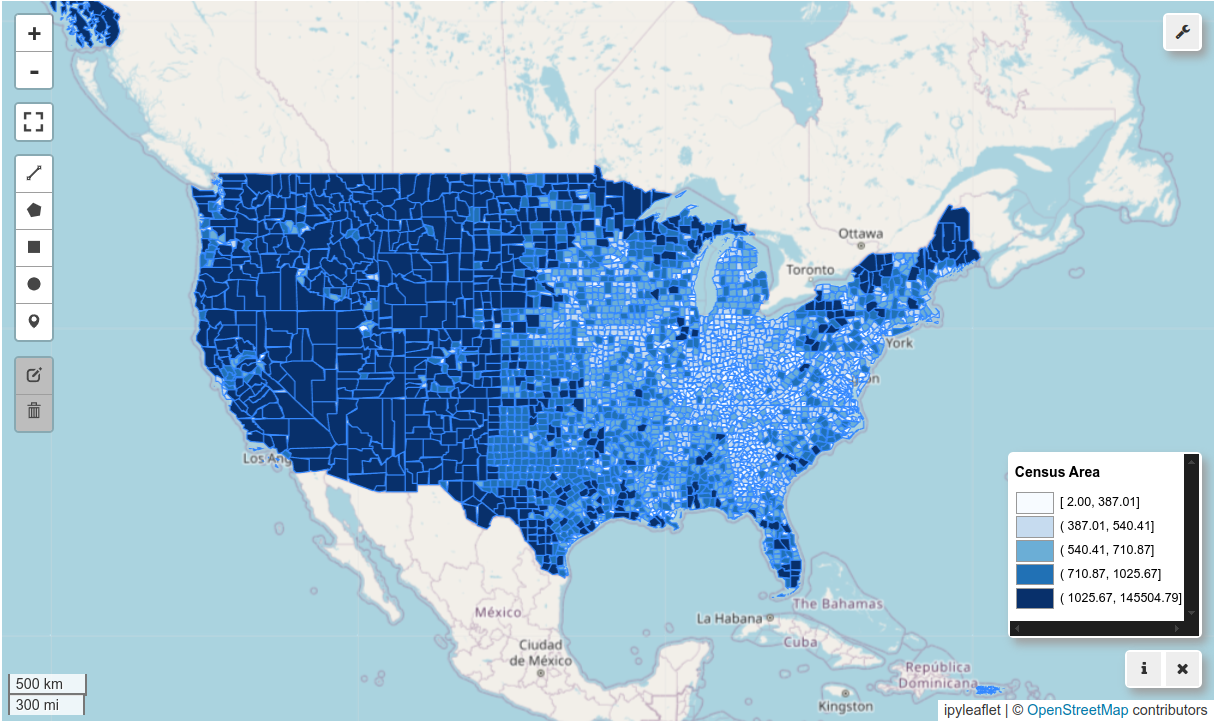
Create a choropleth map of county areas in the US:
URL: https://
github .com /opengeos /datasets /releases /download /us /us _counties .geojson Column:
CENSUSAREA
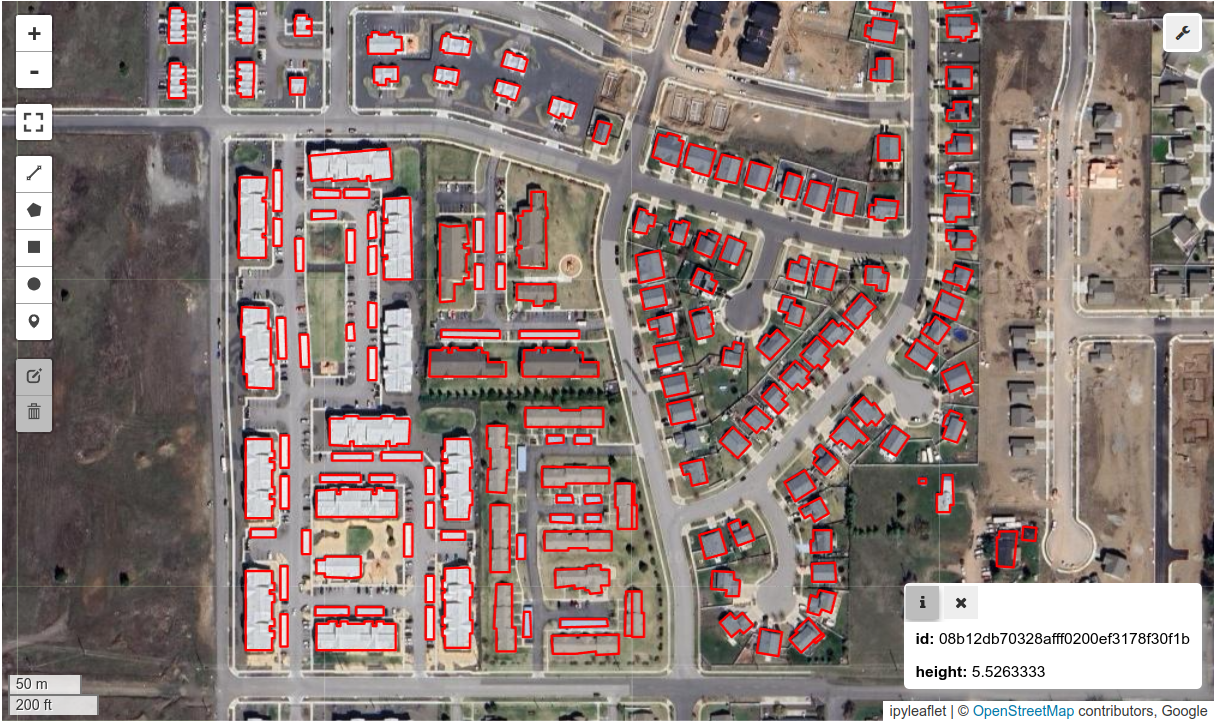
Exercise 6: Visualizing GeoParquet Data
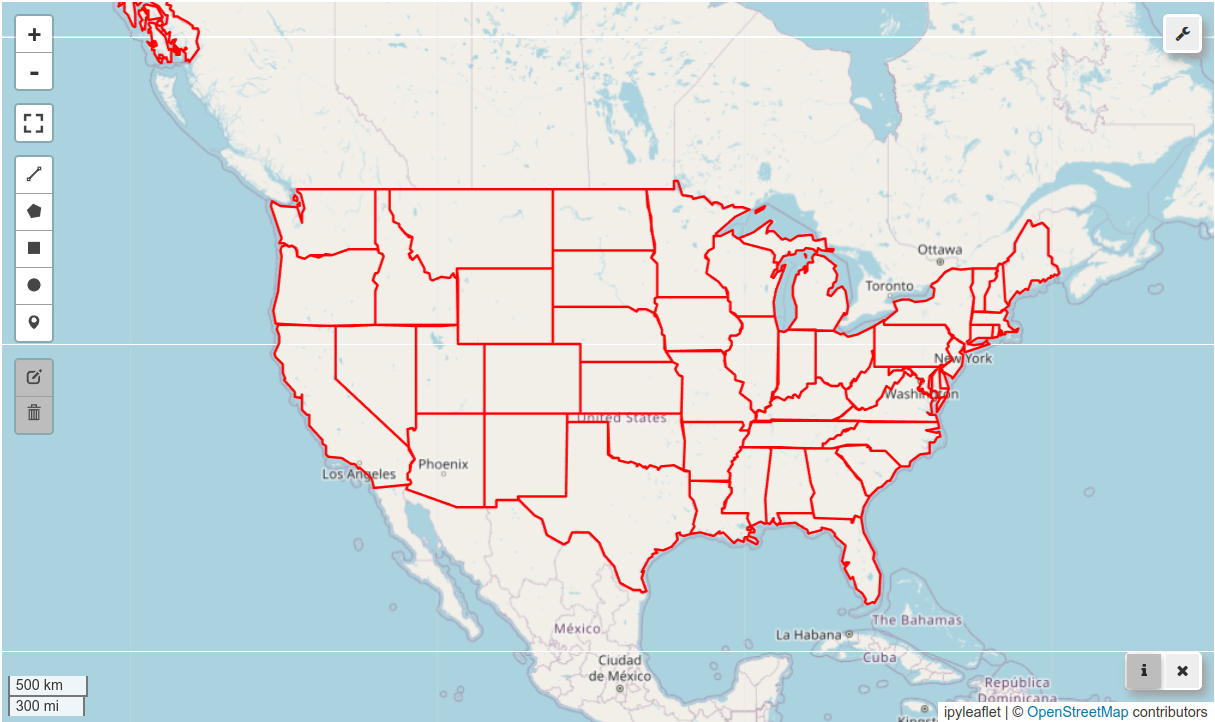
Visualize GeoParquet data of US states:
URL: https://
github .com /opengeos /datasets /releases /download /us /us _states .parquet Style: Outline color of “red” with no fill.
Exercise 7: Visualizing PMTiles
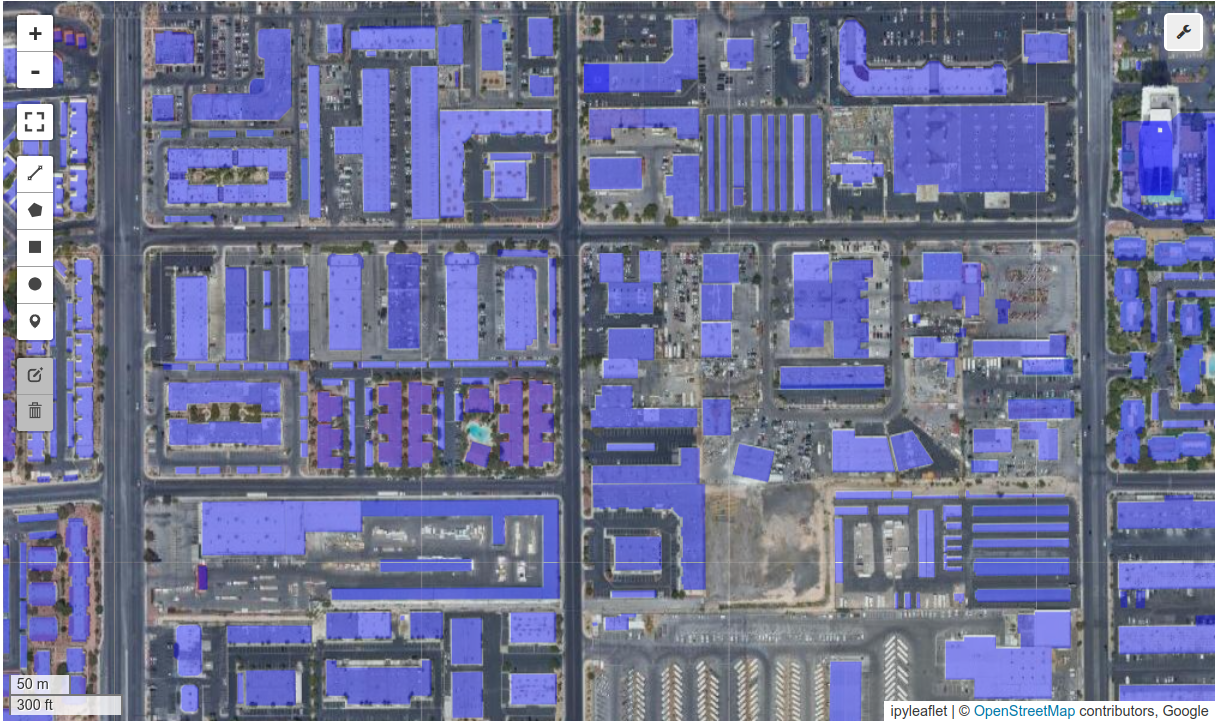
Visualize the Overture Maps building dataset using PMTiles:
URL: https://
overturemaps -tiles -us -west -2 -beta .s3 .amazonaws .com /2024 -09 -18 /buildings .pmtiles Style: Blue fill with 0.4 opacity, red outline.
Exercise 8: Visualizing Cloud Optimized GeoTIFFs (COGs)
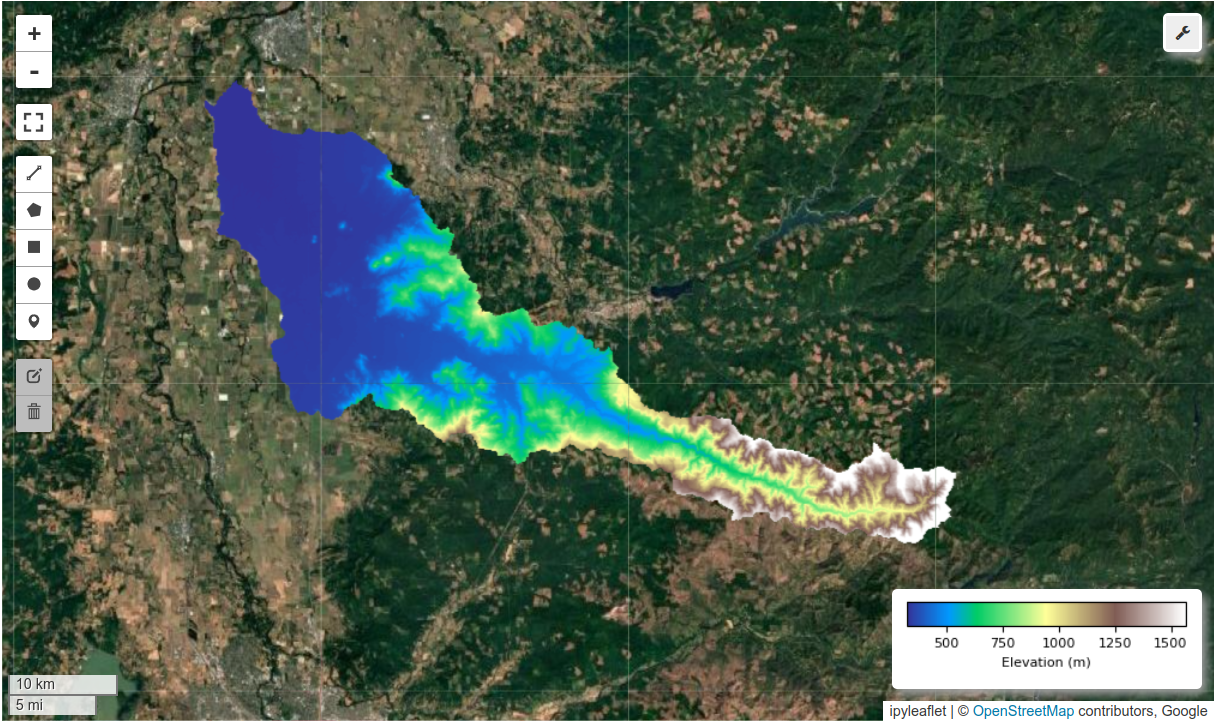
Visualize Digital Elevation Model (DEM) data using the following COG file:
URL: https://
github .com /opengeos /datasets /releases /download /raster /dem .tif Apply a terrain colormap to show elevation values.
Exercise 9: Visualizing Local Raster Data
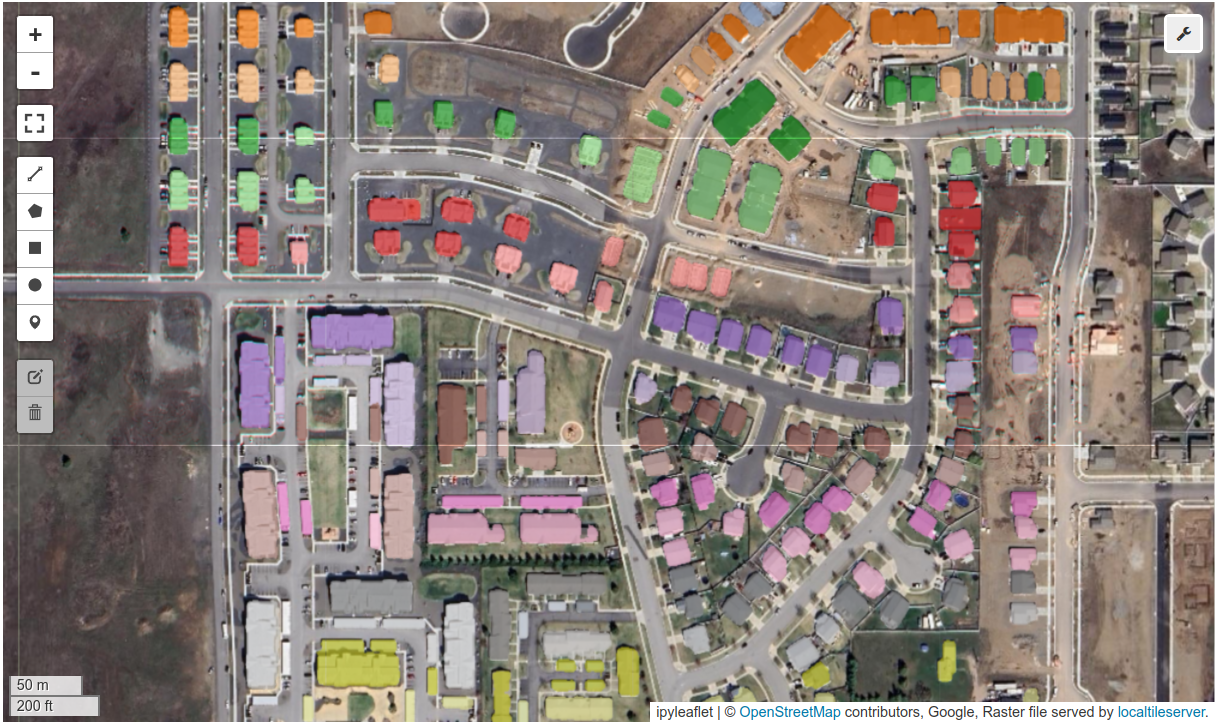
Visualize the following raster datasets using the Map.add_raster() method:
Aerial Imagery: https://
github .com /opengeos /datasets /releases /download /places /wa _building _image .tif Building Footprints: https://
github .com /opengeos /datasets /releases /download /places /wa _building _masks .tif (use the “tab20” colormap and opacity of 0.7)
Exercise 10: Creating a Split Map
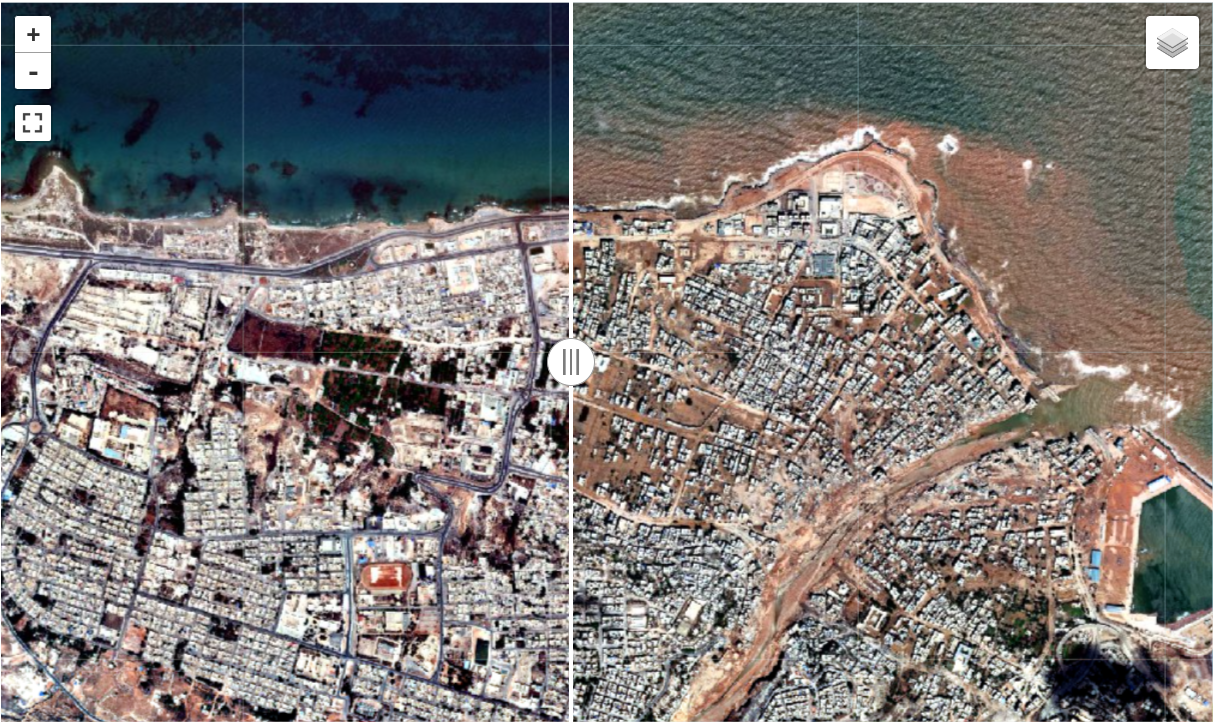
Create a split map to compare imagery of Libya before and after the 2023 flood event: